Progress
July 2019
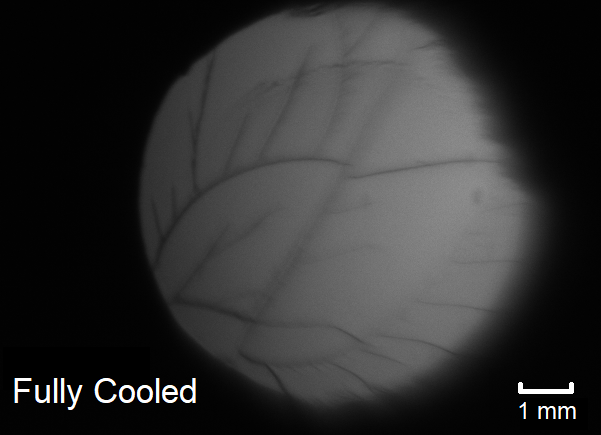
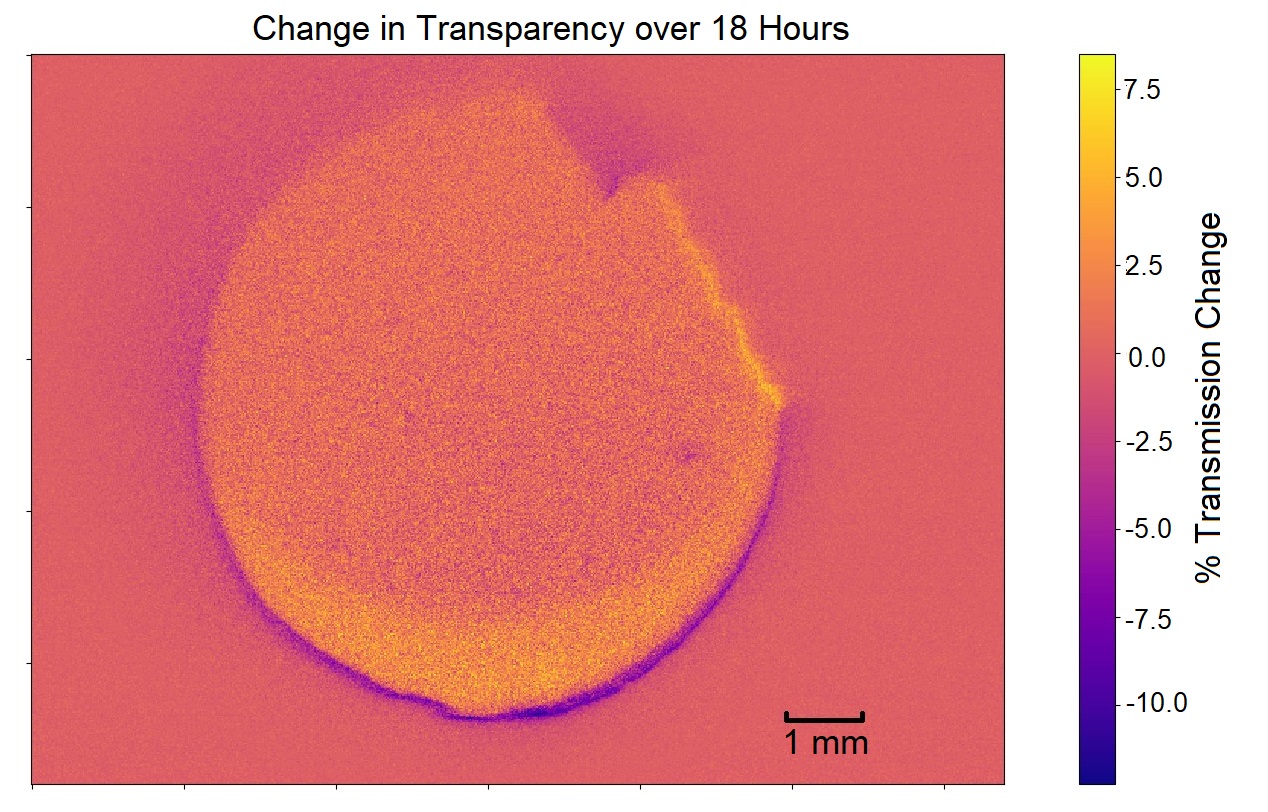
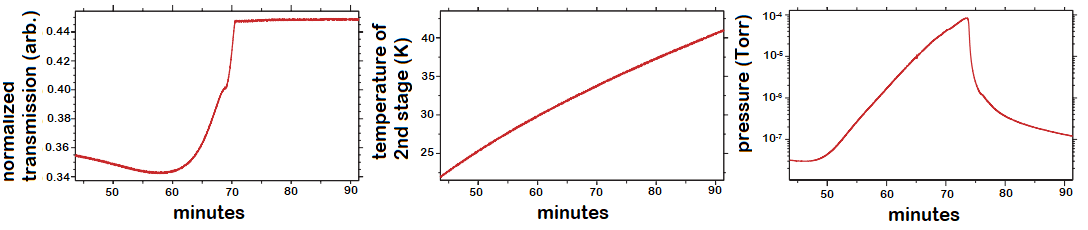
Analyzed cracking behaviour of Argon solid. Cracks are reproducible and arise due to the contraction of Argon as substrate cools. Shards of with surface area of 1 mm2 can maintain transparency over multiple days.
June 2019
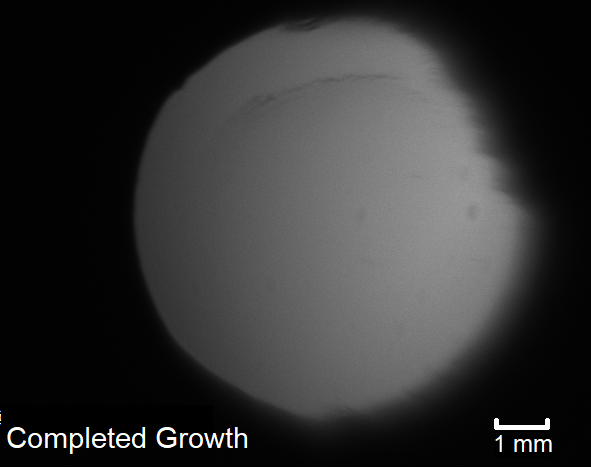
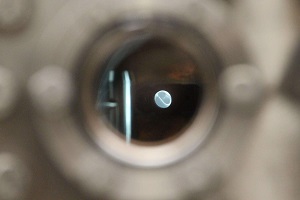
Installed CCD camera to observe transparency across entire substrate during and after growth. Transparency across whole cyrogenic Argon solid is maintained at 95% across multiple days.
Apr 2019
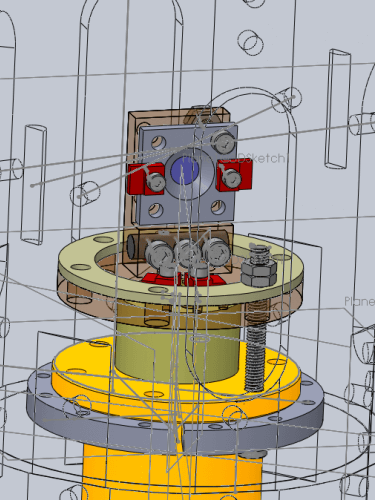
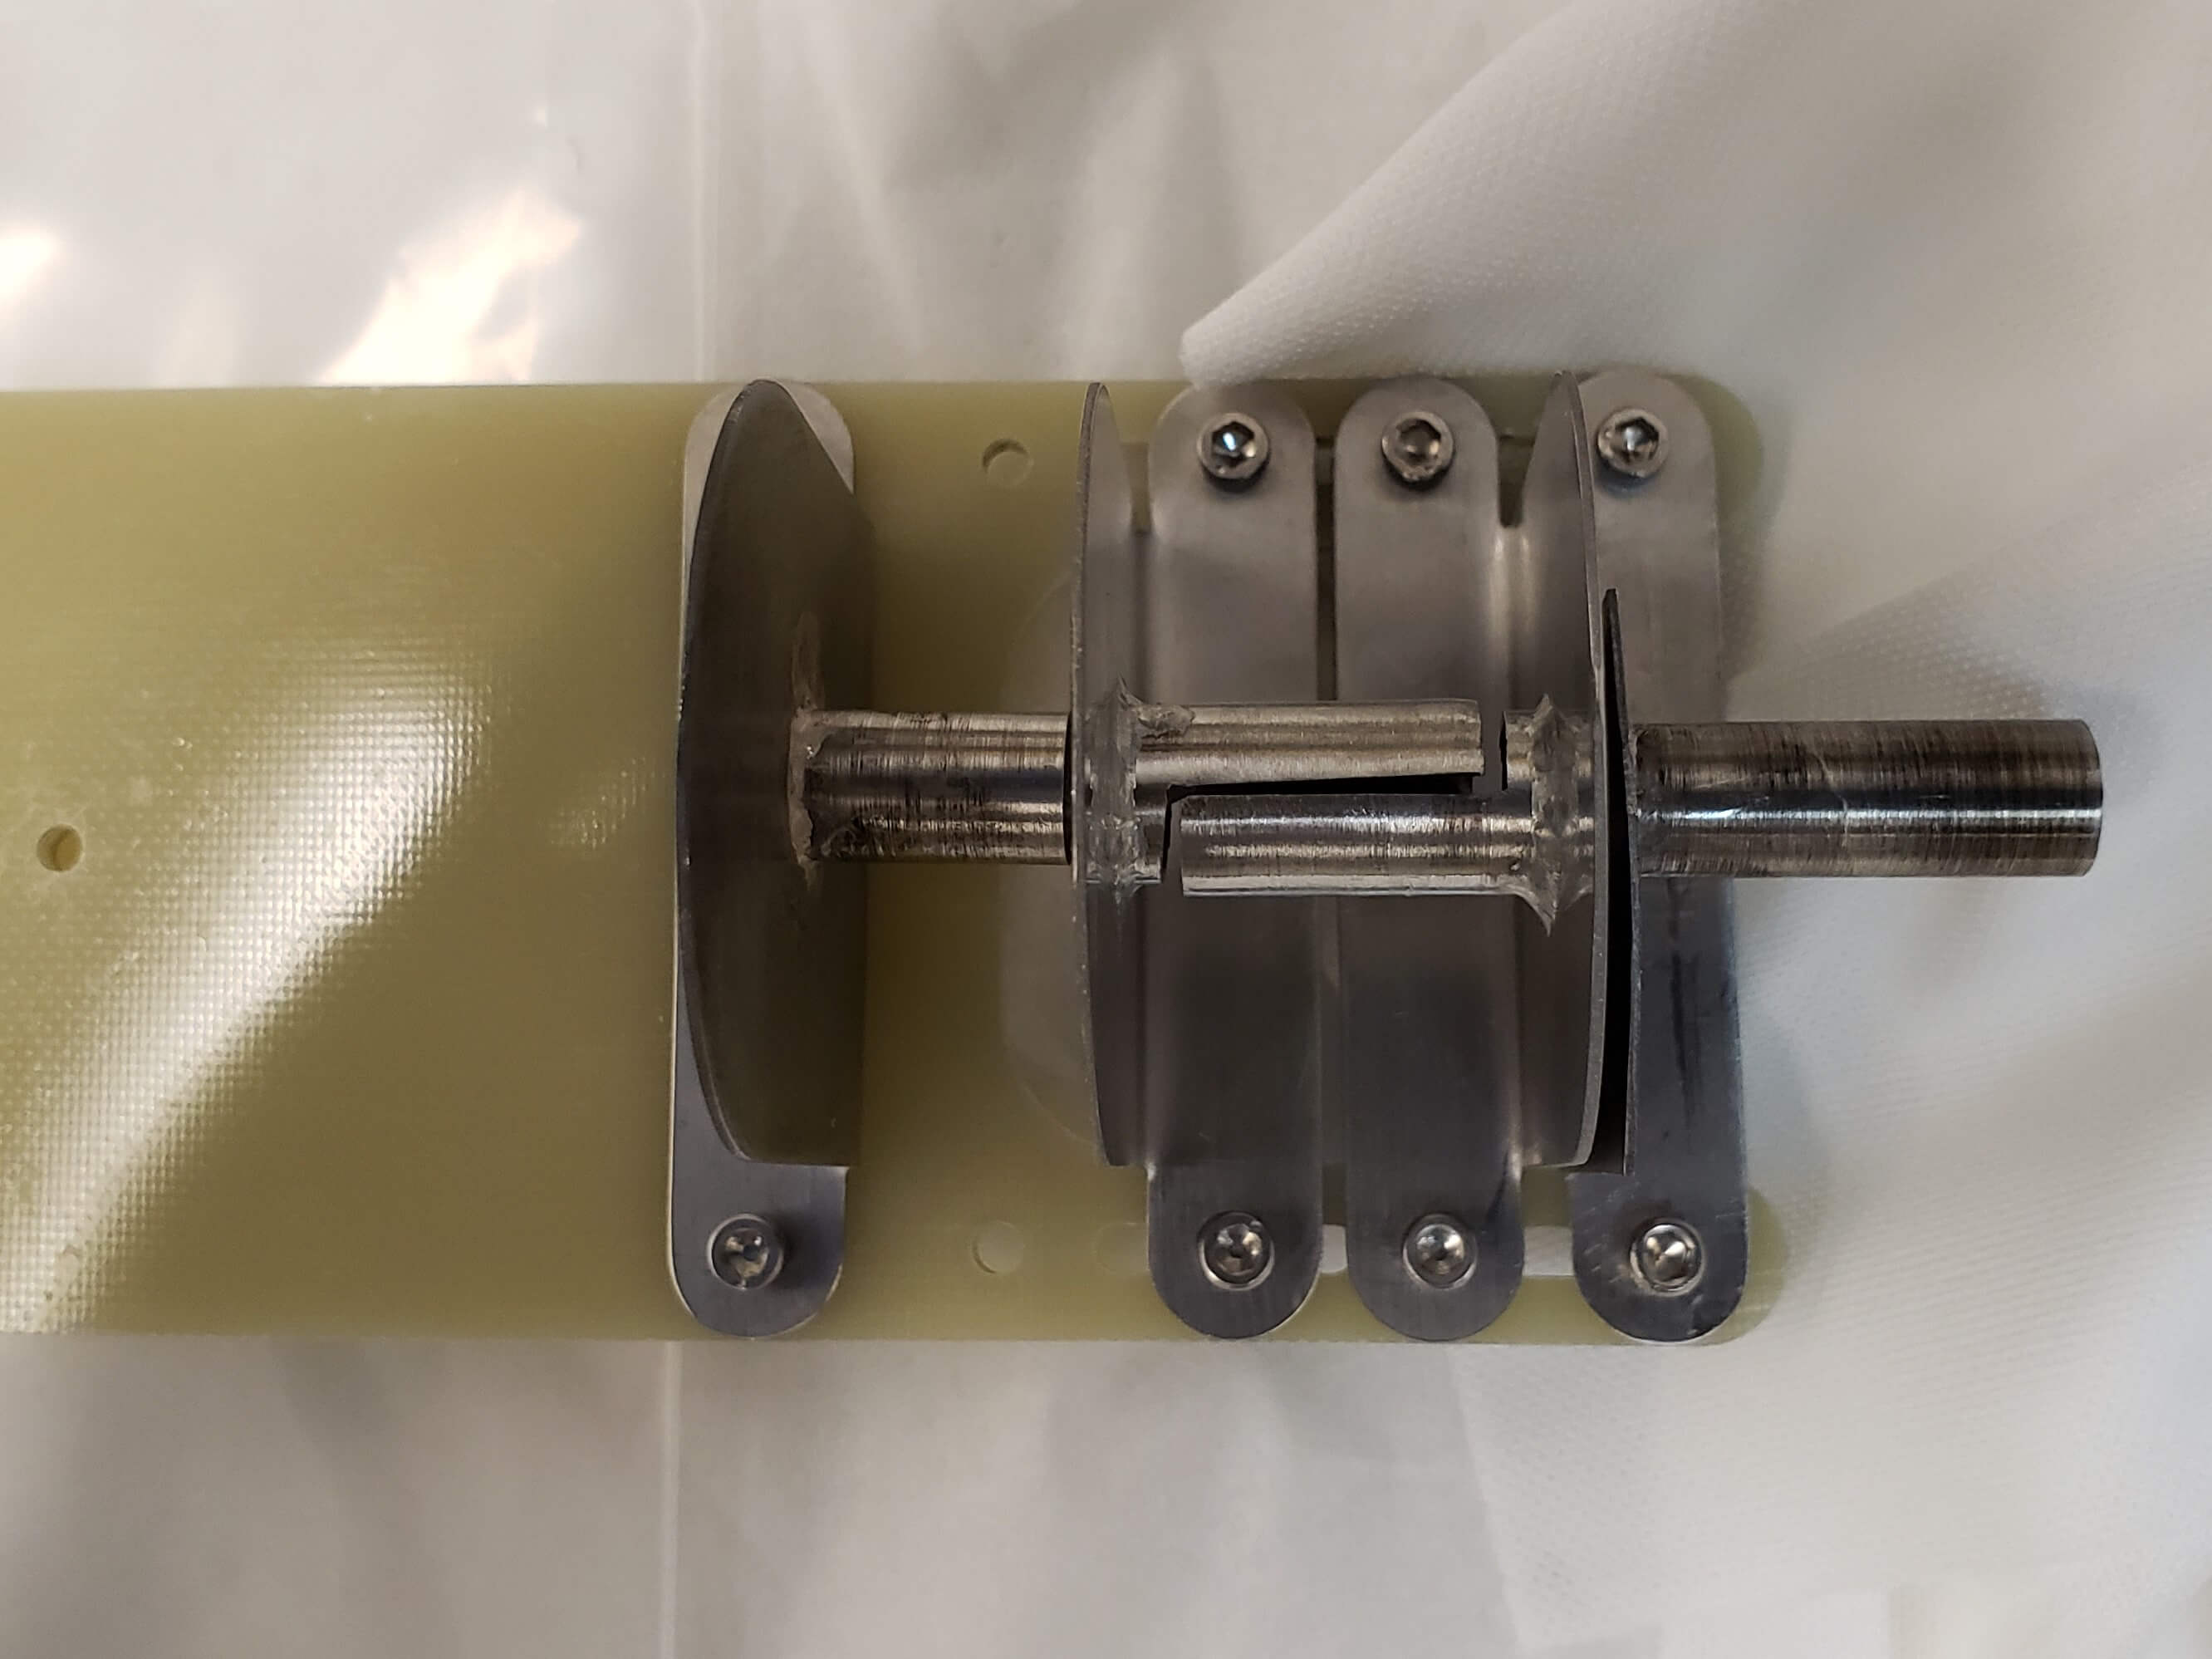
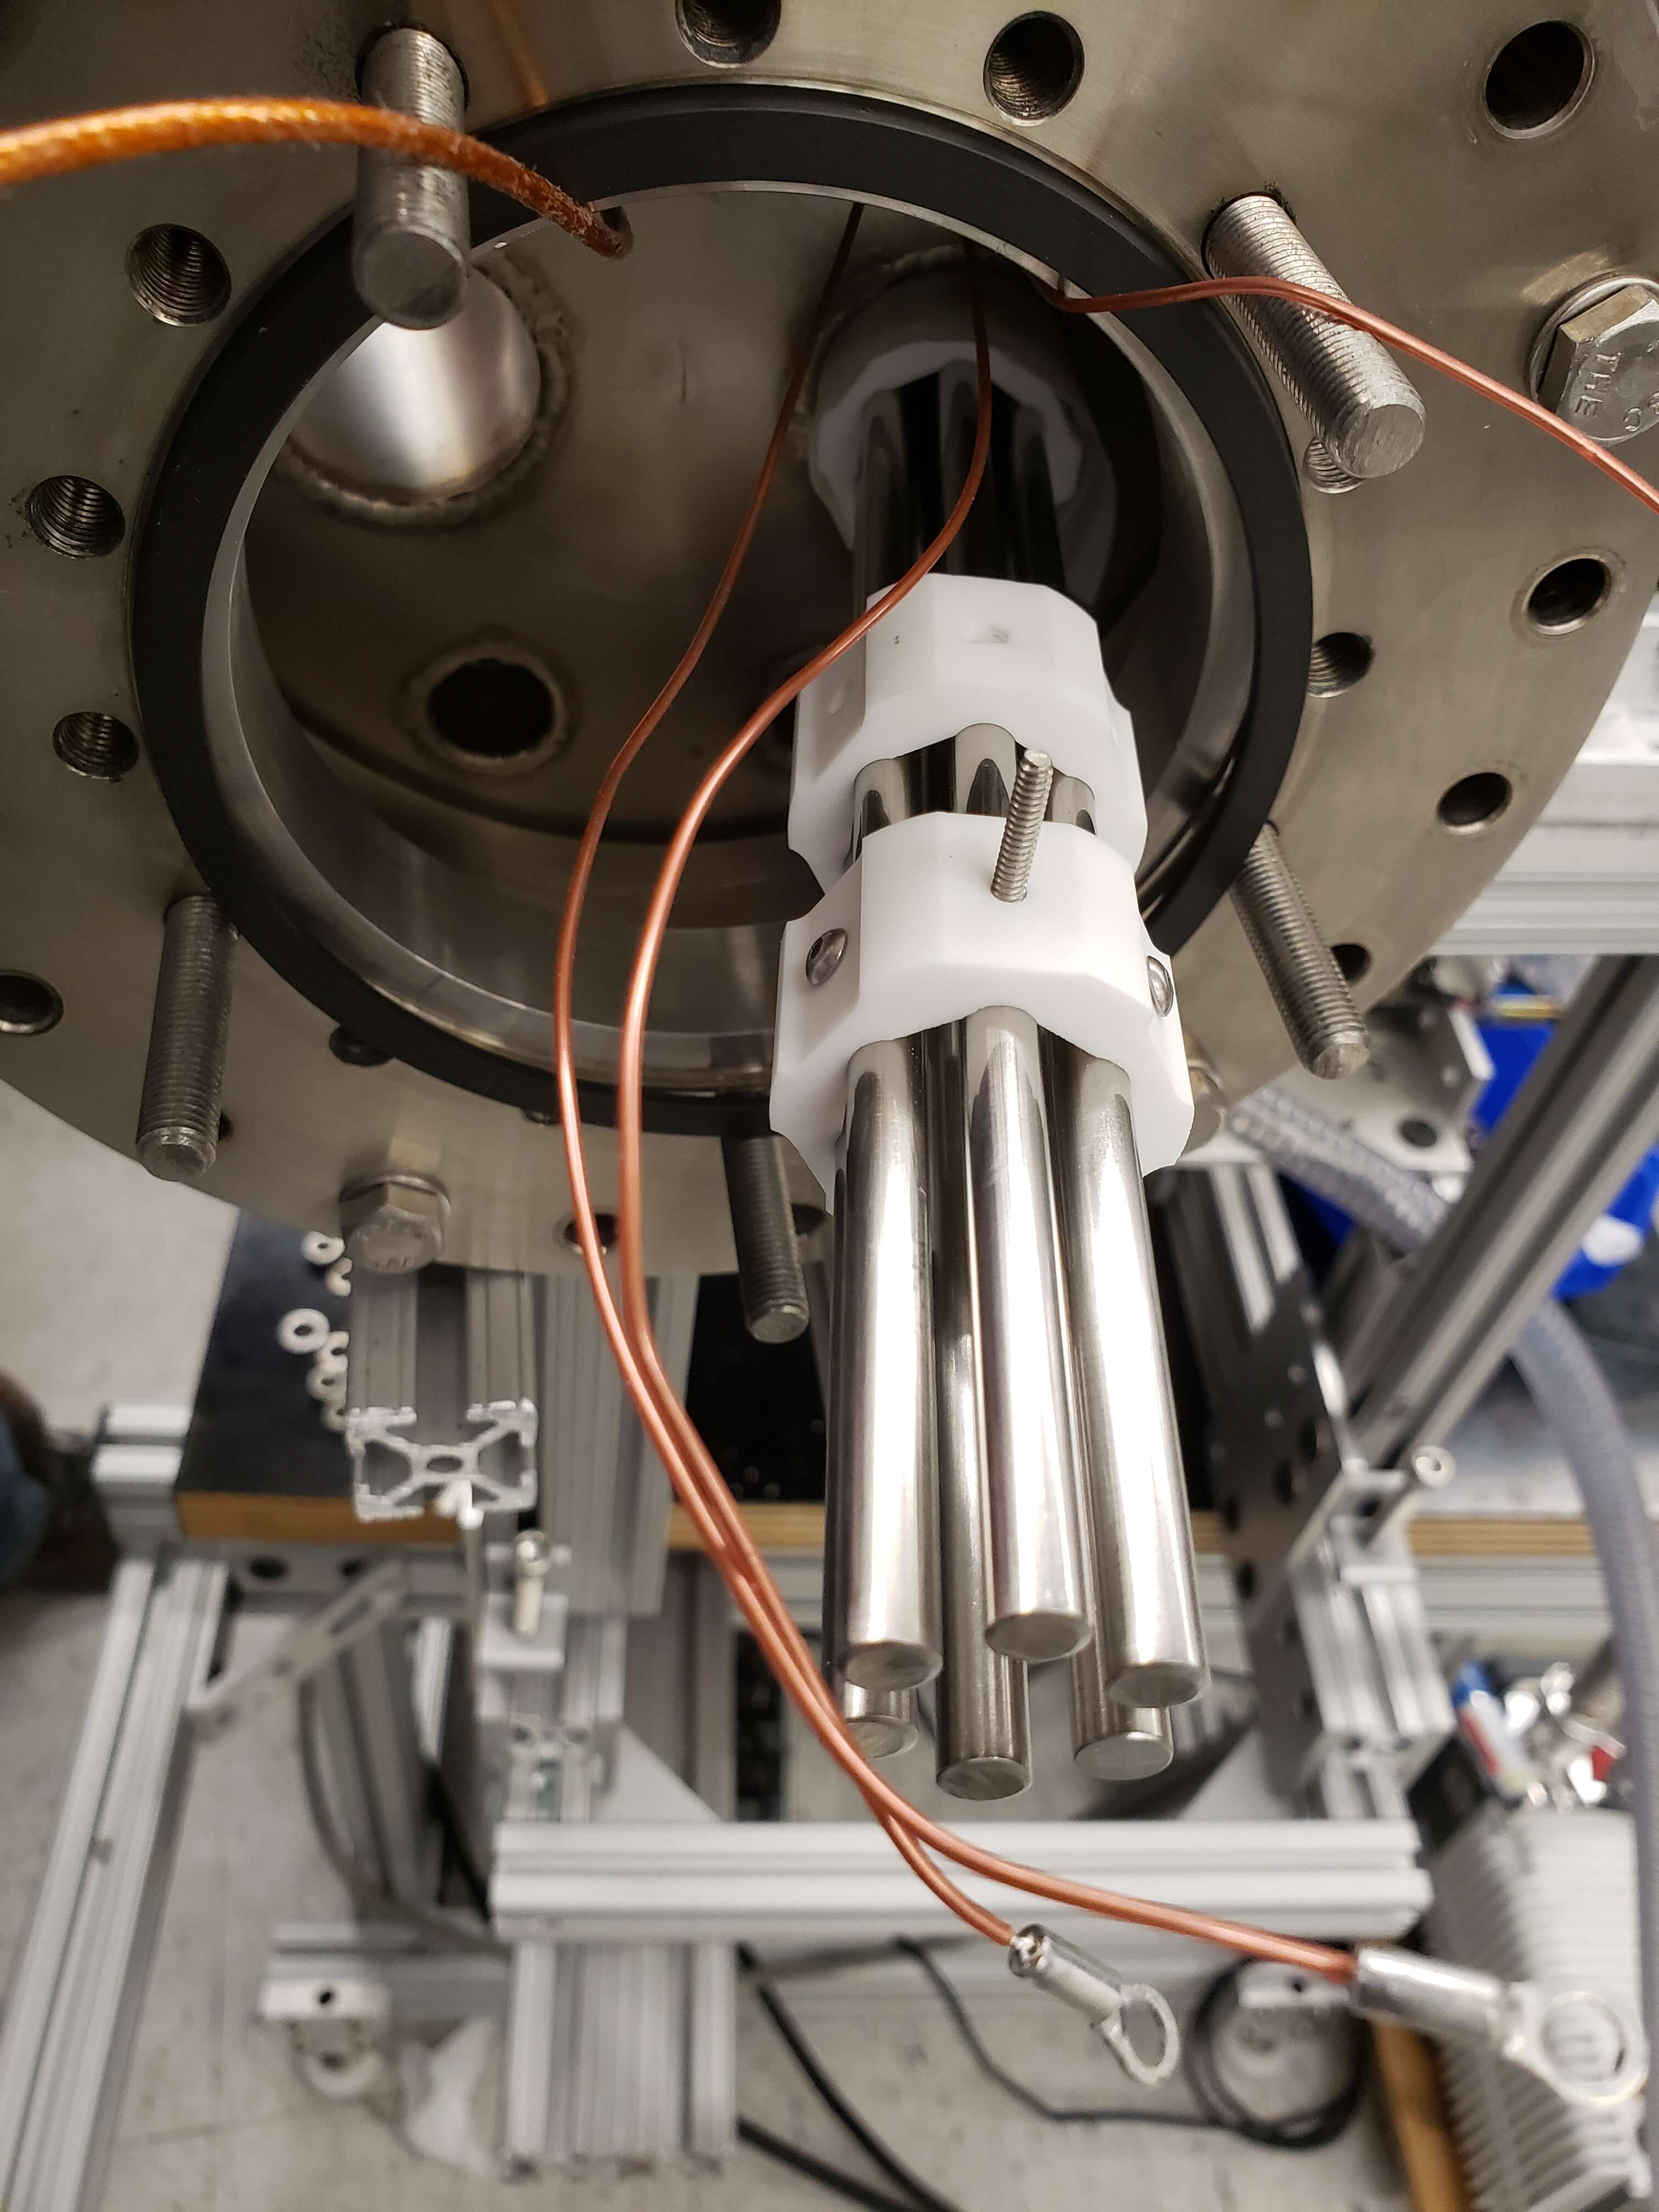
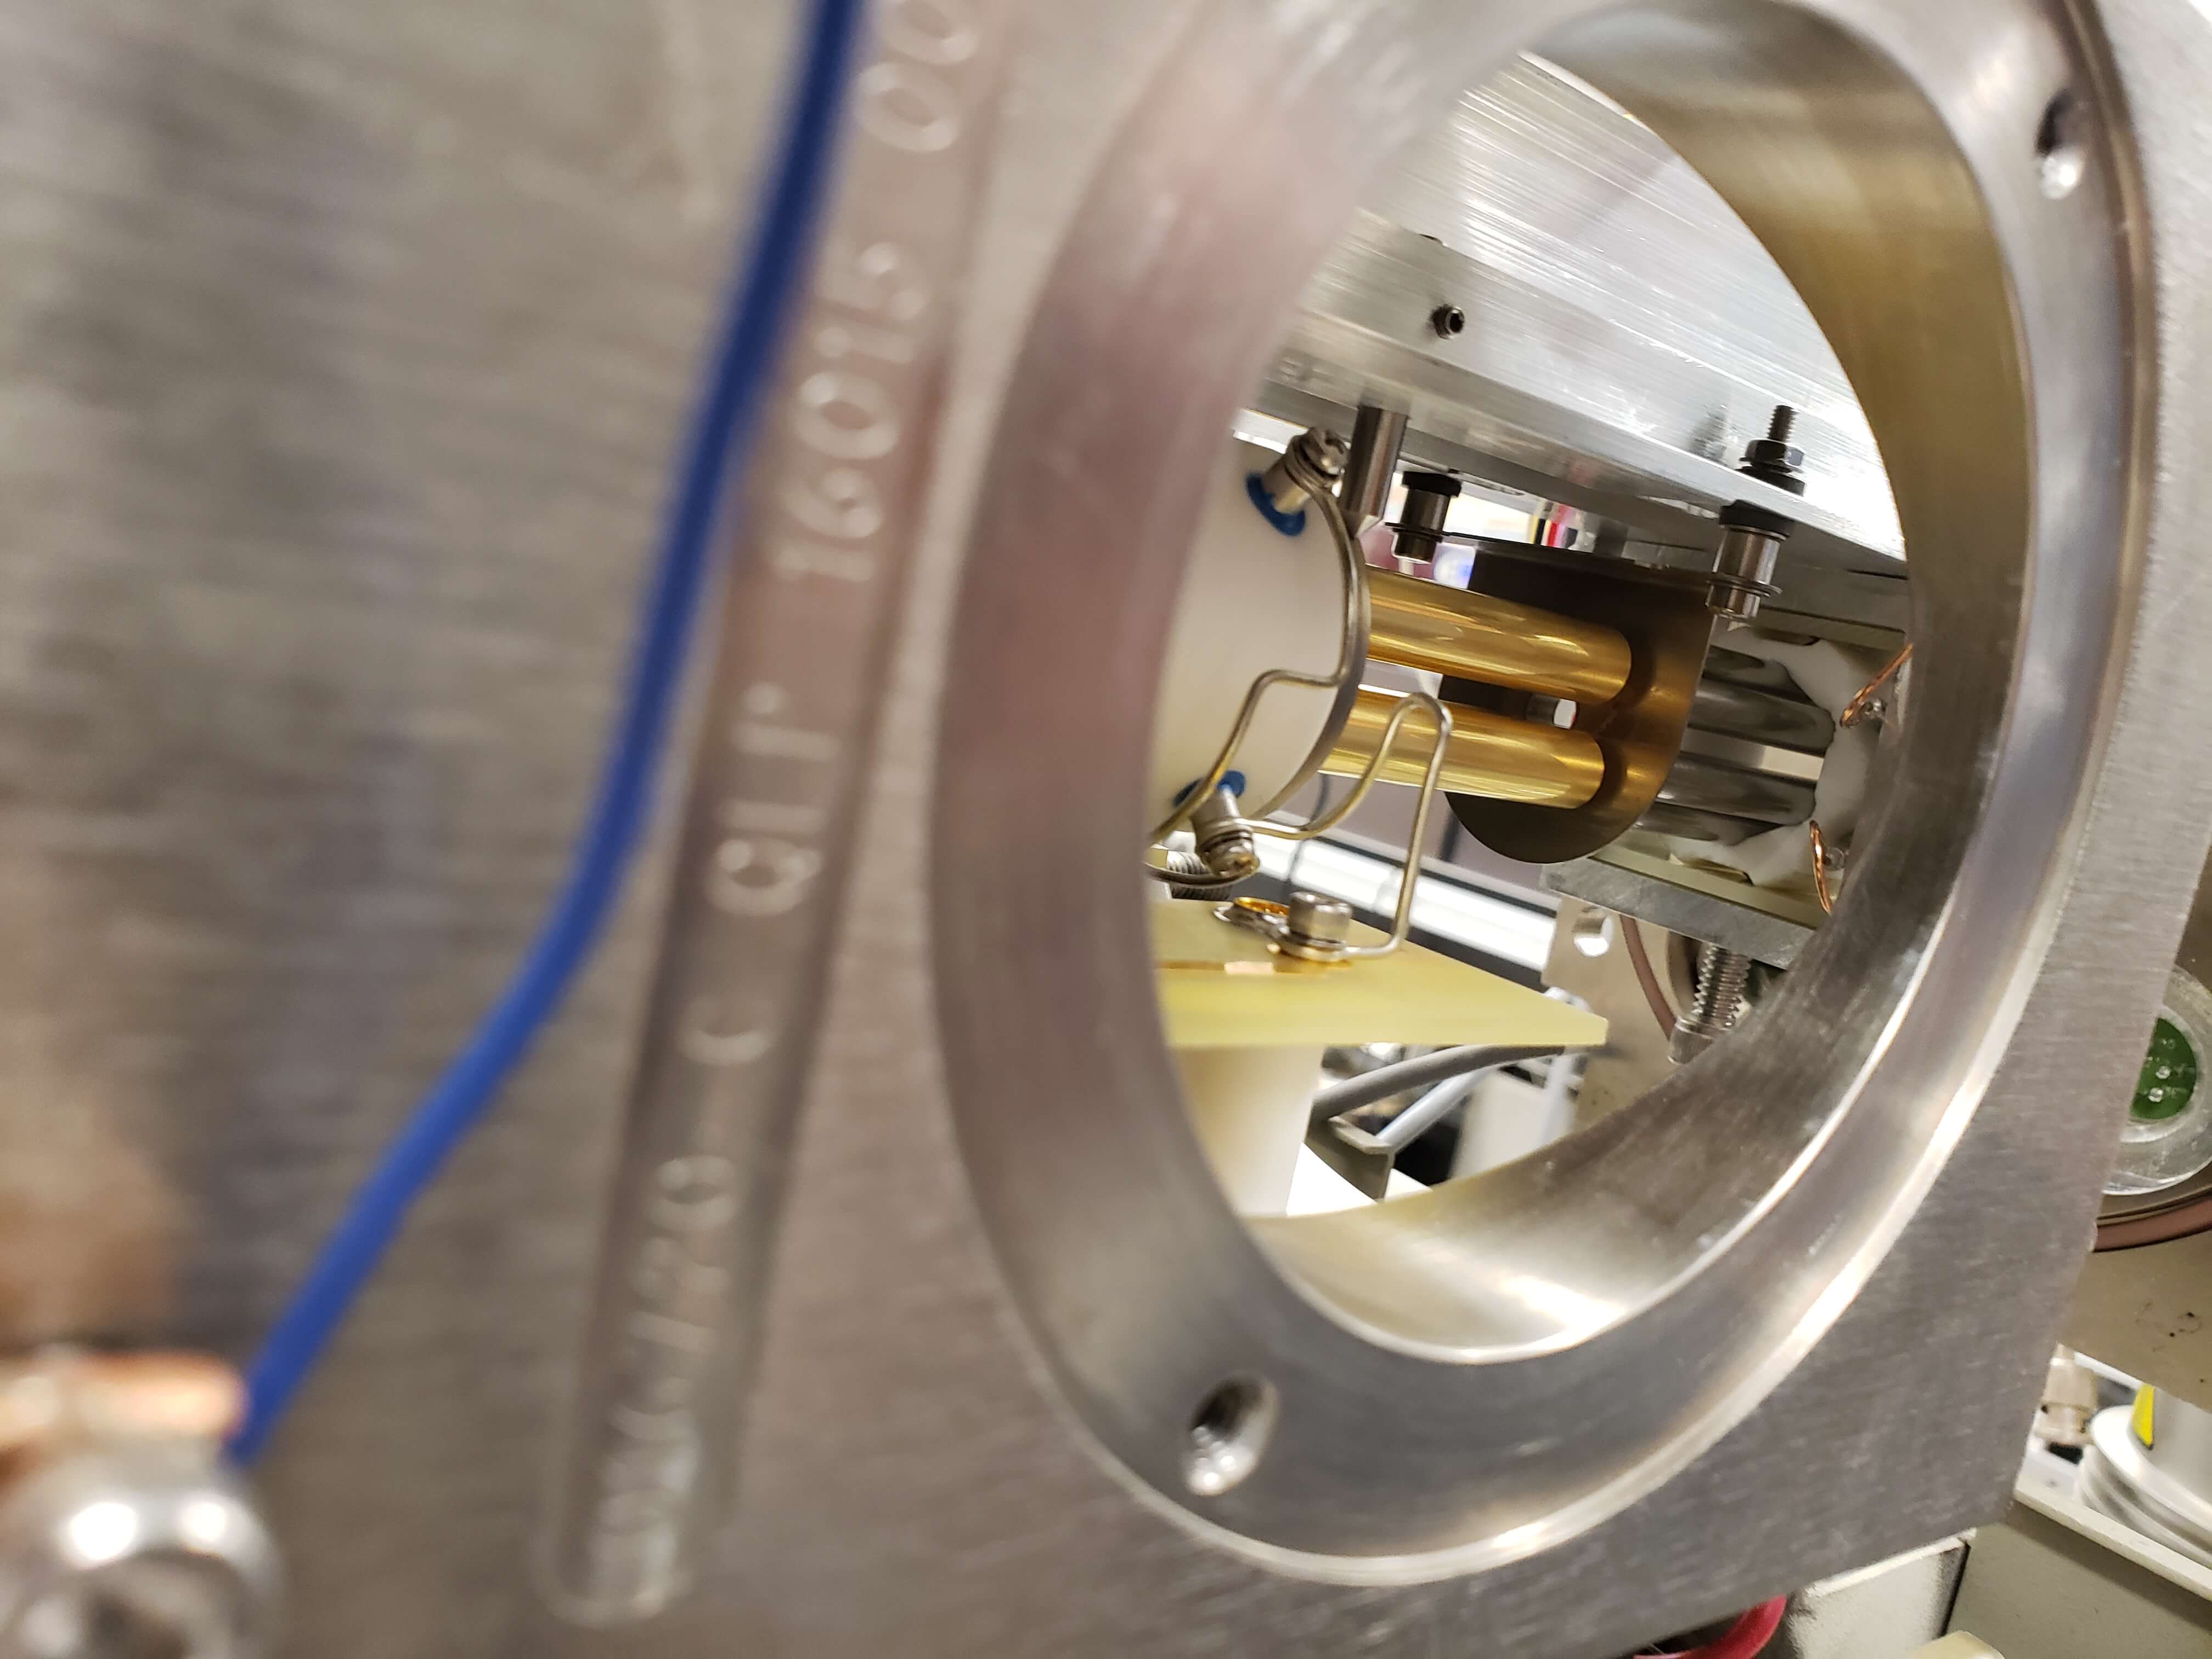
Designed an Einzel lens system used to focus the ions transported by the ion guide onto the cryogenic argon crystal. The middle element of the lens allows either for the transmission of the ions or the deflection of the ions onto a Faraday cup for counting.
Feb 2019
Began experiments to analyze Ar purification techniques in a dedicated vacuum chamber. Our goal is to obtain impurity levels lower than 1 part in 1012.
Jan 2019
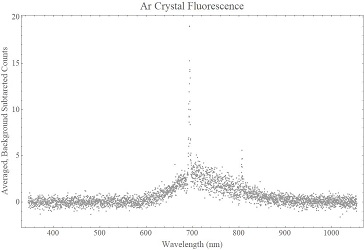
Detected fluorescence spectrum (averaged over 18 hours) of the sapphire substrate on which Ar crystals are grown.
The substrate was illuminated during this time by a 500-mW frequency-doubled Nd:YAG laser.
The fluorescence peak at 694 nm is due to Cr impurities in the sapphire, with the other features being due to spectral impurities in the Nd:YAG laser light.
Dec 2018
Probed microscopic changes in Argon solid surface topology by observing the speckle pattern created by laser light as it scatters through an evaporating argon crystal as it is heated from 20 to 200 kelvin. Two hours of this experiment is captured in the video below.
November 2018
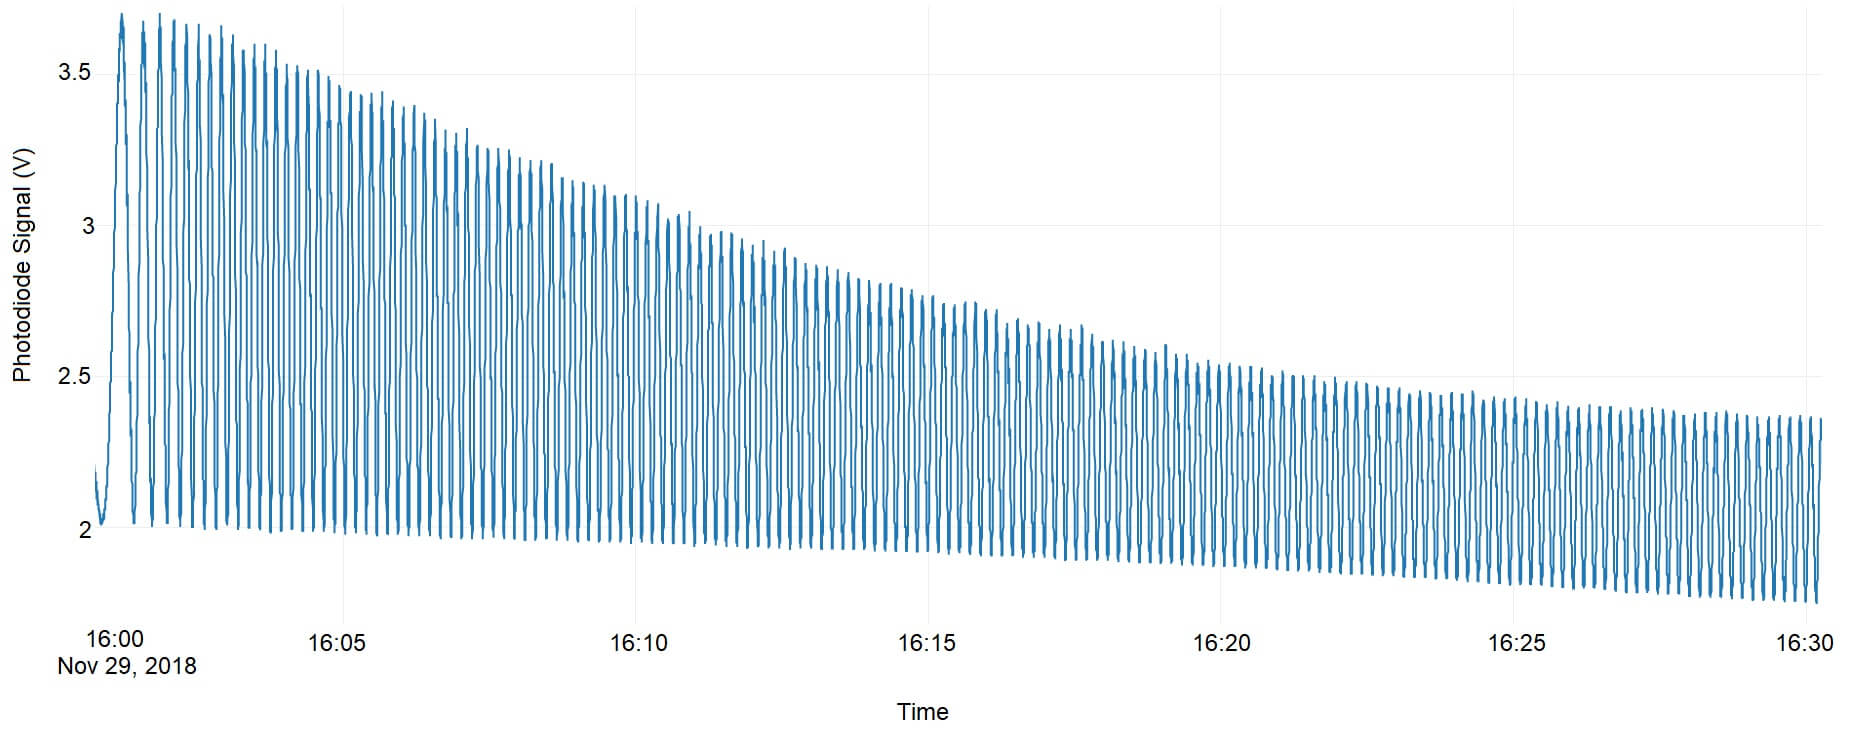
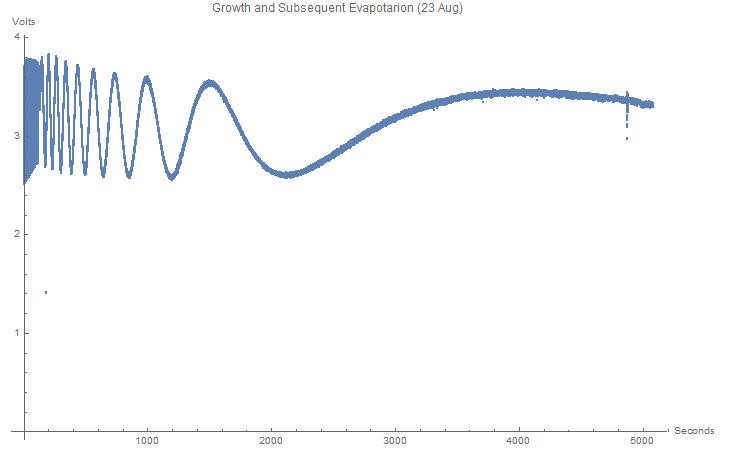
Grew an 360-μm-thick argon cryogenic solid over a period of 4.5 hours at a rate of just under 6 interference fringes (1.5 μm) per minute. Below is a snapshot of the first half hour of growth.
October 2018
Connected Hexapole Ion Guide to Commercial Electrospray Ion Source. Transported BaF+ ions with near-100% efficiency to end of hexapole guide by using angular deviations in the ion path to reduce on-axis neutrals. Differential pumping in the transfer system permitted chamber pressures on the order of 10-8 torr.
September 2018
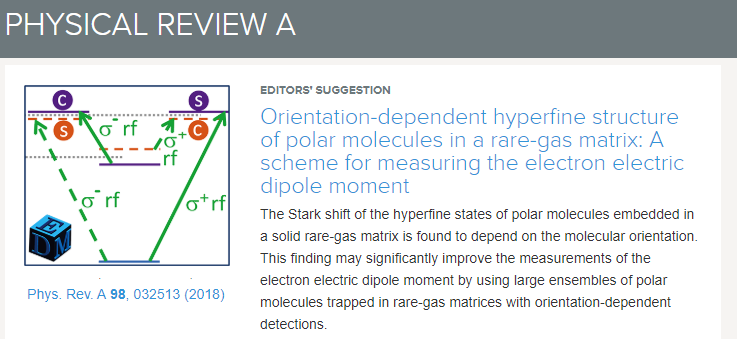
Published article describing hyperfine structure of oriented polar molecules and details proposed EDM3 experimental method.
August 2018
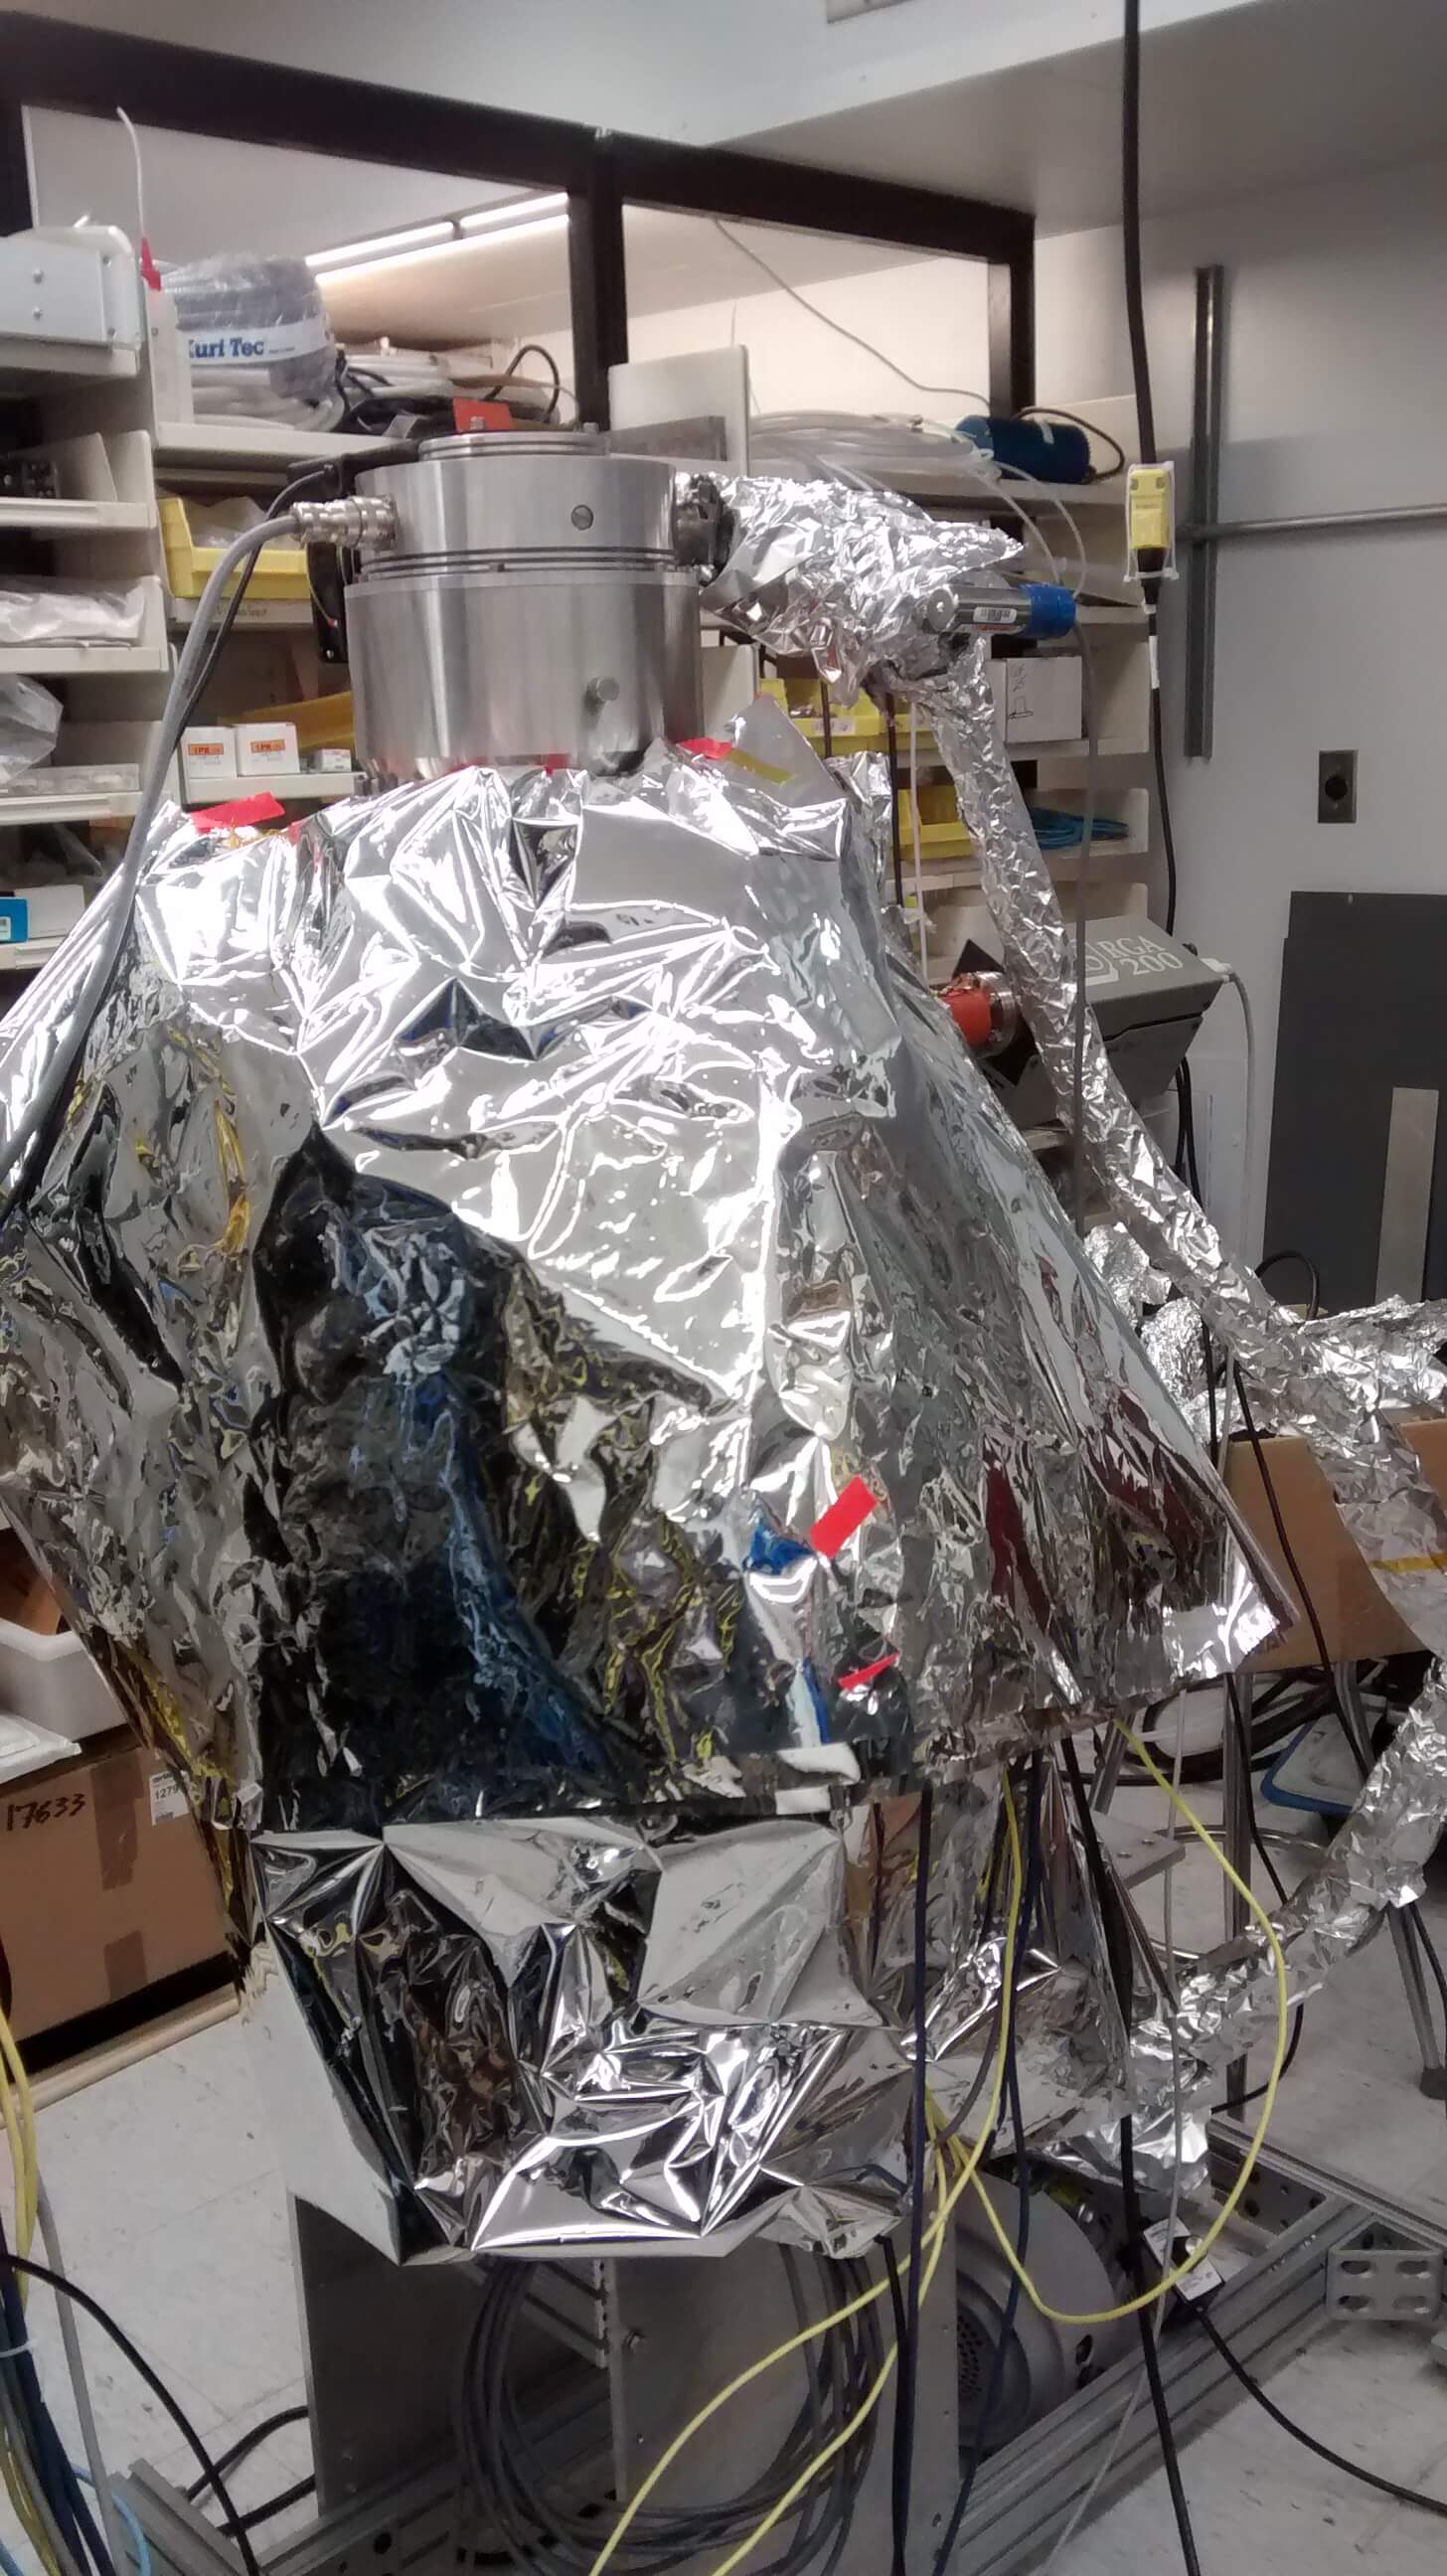
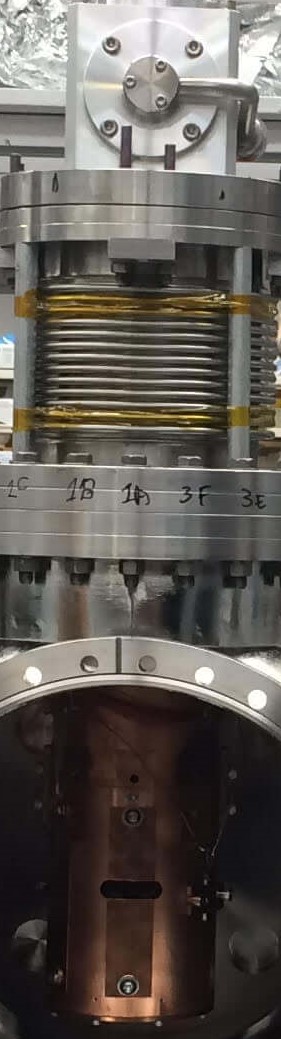
Inserted coldhead into vacuum system and create first cryogenic Ar solid.
July 2018
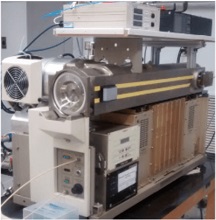
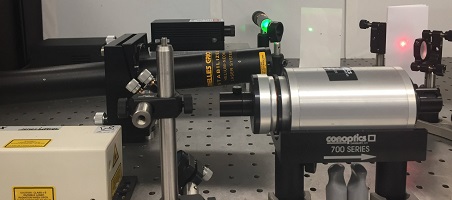
Acquired and tested three laser systems: an external-cavity diode laser with a wavelength tunable from 790 to 870 nm for spectroscopy of BaF embedded in solid Ar, a stabilized HeNe (632 nm) for interferometry, and a Nd:YAG green laser with a power of 500 mW for photoluminescence.
June 2018
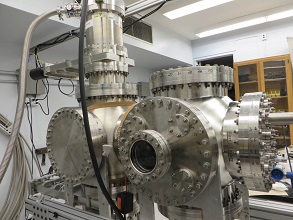
Completed vacuum system to house the experiment.
May 2018
First attempt at Ar annealing.
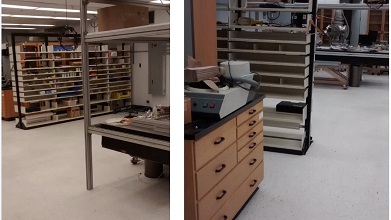
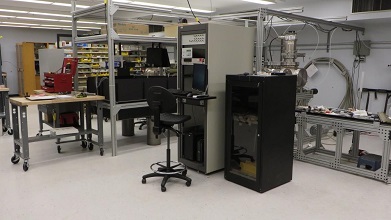
April 2018
Finished renovation on new 2000 square-foot laboratory space.
March 2018
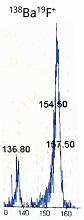
Observed isotopically pure 138Ba19F from an electrospray source.